ICP Scoring Rubric: How to Score, Rank, and Prioritize Your Best Customers
Learn how to build an ICP scoring rubric, weight criteria, rank accounts, set tiers, and prioritize sales and marketing attention.
Key Takeaways
ICP scoring turns your ideal customer profile into a practical system for prioritizing accounts and allocating attention. It measures account-level fit, while lead scoring measures individual engagement or behavior.
Reliable scoring models are based on characteristics that correlate with customer fit and commercial outcomes.
Weight criteria according to their importance, and use negative criteria or disqualifiers to filter out poor-fit accounts.
Examples make an ICP scoring model easier to understand and apply, so show how criteria, weights, scores, and account tiers work in practice.
You’ll know your ICP score is doing its job when it drives action across targeting, sales, ABM, and demand generation, and is updated as your best customers evolve.
Most B2B teams can describe their ideal customer in detail. They know the industry, the general head count, and the tech stack they love to see. But having a written profile on a slide deck doesn't tell sales and marketing which accounts deserve attention first when the next strategy meeting rolls around. That’s how your team’s Friday afternoons end up spent debating how a 20-person regional business somehow ended up tagged as a Tier 1 enterprise target.
ICP scoring is the mechanism that turns a broad consumer profile into an active prioritization system. It gives revenue teams a clear framework for deciding where to allocate outbound effort, account-based marketing (ABM) budgets, paid campaigns, and sales research.
Your ICP defines the type of company you want to sell to. Scoring then shows how closely each target account matches that profile. That distinction matters, because a wishlist of dream logos isn't a scoring model, and gut feeling isn't evidence. Your criteria should come from patterns found in real customers and commercial data in your CRM.
A practical rubric gives sales and marketing a shared way to prioritize accounts and focus effort where the fit is strongest. Instead of leaving everyone to interpret the ICP differently, it helps teams make consistent decisions about where to spend time and resources.
What is ICP Scoring?
ICP scoring is a structured way to rank accounts against the characteristics that define a company’s ideal customers. Instead of describing a target lead with broad characteristics such as company size, industry, technology, or growth stage, teams assign points to those characteristics based on how strongly they indicate a good fit. While a 100-point scale is common for building examples, your internal model can use whatever numeric scale fits your CRM logic.
Sales and marketing have limited attention, so teams need to direct it where it’ll have the greatest impact. For example, you might target U.S. and UK B2B SaaS companies with 200–2,000 employees, a complex sales motion, and a dedicated marketing team. The ICP score translates those parameters into point values so individual accounts can be systematically evaluated.
It's easy to fall into the trap of scoring accounts based on gut feeling though. The CMO likes the logo, the sales team has a wishlist of big-name prospects, and suddenly, the CRM is full of “Tier 1” accounts that look impressive but have little resemblance to the customers who are truly driving revenue. Historical customer and commercial data is a much stronger basis for deciding what deserves a higher score.
ICP Scoring vs. Lead Scoring
ICP scoring and lead scoring answer different questions about the same potential opportunity. ICP scoring asks, “Is this the kind of company we want to sell to?” Lead scoring asks, “How engaged or sales-ready is this individual contact?”
An account can have an excellent ICP score even when nobody at that company has engaged with your brand. Another account, meanwhile, might have a highly engaged contact but be a poor fit for your product. Cue the weekly GTM argument, when marketing celebrates another webinar download while sales asks why nobody talked to the enterprise SaaS account sitting untouched in the CRM. Looking at both dimensions gives sales and marketing a clearer picture of which accounts are worth pursuing and which engaged contacts aren’t a fit.
Understanding that distinction stops your team from chasing highly engaged but poor-fit prospects. Consider these two accounts:
Account A: A 900-employee SaaS company in your target sector using compatible technology, but no one has downloaded your content yet. This account has a high ICP score but low engagement.
Account B: A 40-employee company outside your target segment where one contact attended three webinars and downloaded an ebook. This account has a low ICP score but high engagement.
Account A deserves proactive account-based attention because the commercial fit is high. Conversely, Account B's high engagement doesn’t make it a high-priority account, because it lacks the organizational profile to become a successful customer. Aligning these perspectives requires a reliable lead scoring model that pairs account fit with buyer intent.
Criteria to Include in an ICP Scoring Model
The best ICP scoring criteria meaningfully distinguish strong customers from poor-fit accounts. But not every business needs to include every characteristic. Think of it like building a hiring scorecard. You wouldn't assess a cybersecurity company and a design agency using the same checklist and expect stellar results. A cybersecurity company may care deeply about technology and compliance requirements, while a professional services firm might focus more on company size, business model, geography, and the complexity of the buyer's problem.
Start with the attributes that appear consistently among your best customers, then give those criteria enough weight to influence the final score. Here’s how key categories break down in practice:
Firmographics: Fundamental metrics like revenue, employee count, primary geography, ownership structure, and business model
Industry: Specific sectors or sub-verticals where your solution delivers maximum value
Company Size: Concrete scale indicators, including employee or departmental head count and location count
Technology: Systems, tools, or infrastructure that demonstrate technological compatibility or create an immediate operational need
Growth/Intent Signals: Public hiring activity, funding rounds, active category research, or rapid headcount growth
Pain/Problem Fit: Direct evidence that the account is experiencing the specific problem your product solves
Buying Potential: Commercial budget indicators, organizational complexity, and buying authority
Situational Triggers: Time-sensitive events like leadership changes, platform migrations, or regulatory deadlines
Criteria must be specific and measurable. Rather than adding vague fields like "growing company," use specific parameters like "engineering team grew >20% in 6 months."
Characteristic priorities also vary across industries. A cybersecurity vendor might score heavily on cloud infrastructure, compliance mandates, and IT team size. But a B2B marketing agency is more likely to emphasize marketing team size, growth stage, demand gen infrastructure, and sales cycle complexity.
Adding dozens of fields to your rubric won't improve prioritization if the underlying account records are inaccurate, incomplete, or stale though. In fact, research from Gartner found that 44% of sales leaders cited poor data quality as a barrier to analytical success. Prioritize a smaller set of reliable, commercially verified data points over a bloated, unmanageable scoring matrix.
How to Build an ICP Scoring Rubric
Craft an ICP scoring rubric by starting with your existing customers and working backward. Pinpointing the characteristics that your best accounts share will set you on the right path.
A useful rubric should give different people clear, consistent criteria for evaluating the same account, rather than relying on individual judgment or interpretation. Internal teams have a habit of overengineering this by building 40-field spreadsheets that require an advanced degree in statistics just to update an account score. If the model is too complicated to maintain, it won't stay useful for long.
Follow this process to build your rubric:
Analyze Your Best Customers: Audit closed-won deals, top-tier revenue accounts, retained clients, and high-expansion accounts. Isolate repeating patterns across firmographics, tech stack, hiring trends, and business triggers.
Select Primary Criteria: Select three to eight high-impact attributes rather than tracking dozens of minor data points.
Establish Scoring Tiers: Define specific point values for low, medium, and high fit across every criterion.
Assign Objective Weights: Allocate points to criteria based on how strongly they predict commercial success.
Test Against Real Accounts: Run historical accounts through the rubric to check if top scores match your best commercial outcomes. If high-scoring accounts aren't producing better opportunities, wins, retention, or expansion, revisit the criteria, their weights, and your score thresholds.
Connect Scores to Workflows: Define exact sales and marketing actions triggered by each score tier.
For example, a SaaS company analyzing its customer base might discover that accounts using a specific CRM platform convert faster and are retained longer. Instead of leaving "tech stack" as a generic checkbox, the team might create a clear rubric rule like:
Compatible Stack (e.g., Target CRM + Marketing Automation): High Score (+20 pts)
Workable Stack (Requires custom integration): Medium Score (+10 pts)
Incompatible Stack (Unsupported legacy systems): Low Score/Disqualifier (0 pts)
Ideal Customer Profile Scoring Rubric Example
A scoring rubric becomes much easier to understand when the criteria, weights, account assessment, and resulting score are visible in one place. The example below uses a 100-point model for a fictional B2B SaaS company, with points distributed across industry, company size, technology and problem fit, growth signals, and buying potential.
The exact weights will vary by business. Criteria that provide stronger evidence of commercial fit should have a greater influence on the final score.
To see how this all works in practice, meet Northstar Analytics, our fictional dream account. It’s exactly the kind of company every sales team wishes would land just before the end-of-quarter review. Right industry, right size, right tech stack, active problem, and enough buying potential to make everyone suddenly very interested in the CRM.
The model distributes those 100 points across six primary criteria:
Criteria | Weight | Point Range |
Industry | 20 | 0–20 |
Company Size | 15 | 0–15 |
Technology Fit | 20 | 0–20 |
Problem Fit | 20 | 0–20 |
Growth/Intent Signals | 15 | 0–15 |
Buying Potential | 10 | 0–10 |
Total | 100 | 0–100 |
Each section follows explicit scoring rules:
Industry (20 pts): Core target industry = 20 pts; adjacent industry = 10 pts; unproven industry = 0 pts
Company Size (15 pts): Ideal employee range (200–1,000) = 15 pts; serviceable range (100–199) = 8 pts; out of bounds = 0 pts
Technology Fit (20 pts): Fully compatible stack = 20 pts; workable environment = 10 pts; incompatible stack = 0 pts
Problem Fit (20 pts): Clear evidence of core problem = 20 pts; limited evidence = 10 pts; no evidence = 0 pts
Growth/Intent Signals (15 pts): Multiple current hiring/funding signals = 15 pts; single signal = 8 pts; no active signals = 0 pts
Buying Potential (10 pts): Confirmed budget and realistic process = 10 pts; moderate potential = 5 pts; severe purchasing barriers = 0 pts
Worked Example: High-Fit Account
Now, apply the rubric to the aforementioned fictional account, Northstar Analytics (U.S.-based B2B SaaS, 500 employees, target tech stack, active hiring, verified problem fit):
Criteria | Weight | Assessment | Score |
Industry | 20 | Core target industry | 20 |
Company Size | 15 | Strong fit at 500 employees | 12 |
Technology Fit | 20 | Highly compatible stack | 18 |
Problem Fit | 20 | Clear, active problem | 18 |
Growth/Intent Signals | 15 | Strong hiring and category activity | 10 |
Buying Potential | 10 | Good potential, complex process | 6 |
Total | 100 | 84 |
Northstar Analytics achieves an 84/100 here because its core profile, tech stack, and problem alignment match existing, successful customers. Moderate buying complexity keeps it from a perfect score.
Worked Example: Moderate-Fit Account
Now, compare it with the fictional Harbor Systems (adjacent industry, 75 employees, partially compatible stack, limited growth signals):
Industry: 10/20
Company Size: 0/15
Technology Fit: 10/20
Problem Fit: 10/20
Growth Signals: 8/15
Buying Potential: 10/10
Total Score: 48/100
Comparing the two accounts shows how scoring dictates resource allocation. Northstar Analytics (84/100) would warrant deep research, direct rep outreach, and 1:1 ABM campaigns. Meanwhile, Harbor Systems (48/100) would stay in automated marketing nurtures and wouldn’t receive manual sales effort.
Be aware, a score of 80 or higher isn't a reliable benchmark for every business. Thresholds must reflect your company's real account distribution and historical deal performance.
How to Weight ICP Criteria and Set Account Tiers
Not every ICP characteristic deserves equal influence. Weight criteria according to how strongly they relate to customer quality, deal success, retention, expansion, or other outcomes that matter to the business.
Once scores are calculated, group accounts into practical tiers. Trying to give every inbound account the white-glove, bespoke Tier 1 treatment is a fast way to create chaos, especially when your entire marketing team is basically two overworked veterans. A high-fit account might receive deeper research and personalized outreach, while a lower-fit account would only need broader marketing activity. The tier definitions should connect directly to how your team allocates resources.
Prioritizing accounts based on objective fit and commercial signals is a standard practice in modern ABM motions. Foundry even reports a whopping 91% of B2B technology marketers use intent data to prioritize accounts, select content, and build target account lists.
Weighting criteria then reflects predictive value. So, if tech stack compatibility predicts customer retention better than geography, tech stack gets a higher point weight.
Score ranges should translate into operational tiers, such as:
Tier 1 (e.g., 80–100 pts): Top-tier target fit. Direct sales prioritization, custom content, high-touch 1:1 ABM, and bespoke research.
Tier 2 (e.g., 60–79 pts): Strong fit. Scalable personalization, segment-based, 1:few campaigns, and automated outbound sequences.
Tier 3 (e.g., Below 60 pts): General addressable market. Broad demand generation, social targeting, and automated nurture paths.
That means, using our earlier example, Northstar Analytics (84/100) would sit in Tier 1 and receive dedicated rep research and custom ABM assets. For its part, Harbor Systems (48/100) would fall into Tier 3 and receive standard, automated program content.
Using Negative Criteria and Disqualifiers
Some accounts look attractive on paper but turn out to be poor prospects as sales teams learn more about their needs, constraints, or buying environment. Negative criteria help surface those warning signs during qualification by subtracting points or disqualifying accounts altogether.
That could look like an incompatible technology environment, an unsupported geography, a business model your product can't serve effectively, or a problem your solution doesn't solve well. Reviewing poor-fit and churned customers reveals these patterns and makes the scoring model more realistic. In turn, teams avoid investing heavily in accounts that are unlikely to become successful customers.
Common B2B disqualifiers include:
Unsupported geographic markets or legal/data compliance boundaries.
Incompatible underlying tech architecture.
Account size below minimum service thresholds.
Custom feature requests that fall completely outside product roadmaps.
Relying on positive criteria alone can inflate account scores. A target can check every firmographic box while hiding a deal-breaking operational constraint. Be sure to look at both sides of the ICP coin.
The Power of Disqualifiers
Consider the following info for the made-up company Acme Global:
Target Industry: 20/20
Ideal Company Size: 15/15
Problem Fit: 20/20
Growth Signals: 15/15
Buying Potential: 10/10
Initial Score: 91/100
Based on these numbers, Acme Global looks like a prime Tier 1 prospect. However, discovery then reveals Acme runs on a legacy, on-premise architecture that your cloud-native software can’t integrate with.
If your model only subtracts five points for tech mismatch, Acme retains an 86/100 score and continues to consume sales resources. Using a strict hard disqualifier overrides the positive points and drops the account from active targeting immediately. Negative criteria adjust points, while hard disqualifiers overrule the total score.
Quantitative vs. Qualitative ICP Criteria
ICP scoring works best when measurable account characteristics are combined with meaningful indicators of business fit. Employee count, revenue, technology, and geography are relatively easy to score consistently. Problem fit, strategic alignment, and buying potential require more judgment.
Qualitative criteria don't have to make the model subjective. Define clear scoring rubrics and evidence requirements so different people can assess them consistently, with minimal bias. The more important a qualitative criterion is, the more explicitly it should be defined.
Quantitative parameters (e.g., head count, funding, tech stack count) are simple to pull automatically from enrichment tools. However, qualitative factors (e.g., urgency, problem severity, buying readiness) require structured human evaluation during early sales conversations.
To keep qualitative scoring consistent, create clear evidence requirements:
Problem Fit Rubric (20 Points Max):
0 pts: No public or conversational evidence that the problem exists.
5 pts: Problem is likely present based on industry, but no direct confirmation.
10 pts: Direct evidence confirms the problem exists, but urgency is low.
15 pts: Active, high-priority problem confirmed by key stakeholders.
20 pts: Critical, urgent problem; account is actively evaluating solutions.
Clear evidence requirements make subjective criteria objective enough for consistent team scoring.
How to Use ICP Scores in Demand Generation
The whole purpose of an ICP score is to positively change what your team does. Use it to guide targeting, prioritization, messaging, and resource allocation. A well-constructed model connects account fit with the signals that show what those accounts are doing now.
An ICP score gives your revenue engine operational focus through:
Outbound Sales: Focus high-touch SDR research and custom video outreach exclusively on Tier 1 accounts.
ABM Audiences: Build custom landing pages and executive programs for top-fit accounts.
Paid Media: Concentrate direct ad spend on verified Tier 1 and Tier 2 account lists to cut wasted impressions.
Content Strategy: Direct bespoke case studies toward Tier 1 buying committees while serving standard content to Tier 3 nurtures.
Focus has a major influence over commercial impact. For example, Clearbit discovered that, while only 18% of their total leads matched their defined ICP, those ICP-fit customers generated over 86% of long-term revenue. Honing in on leads with the greatest potential is worth the investment.
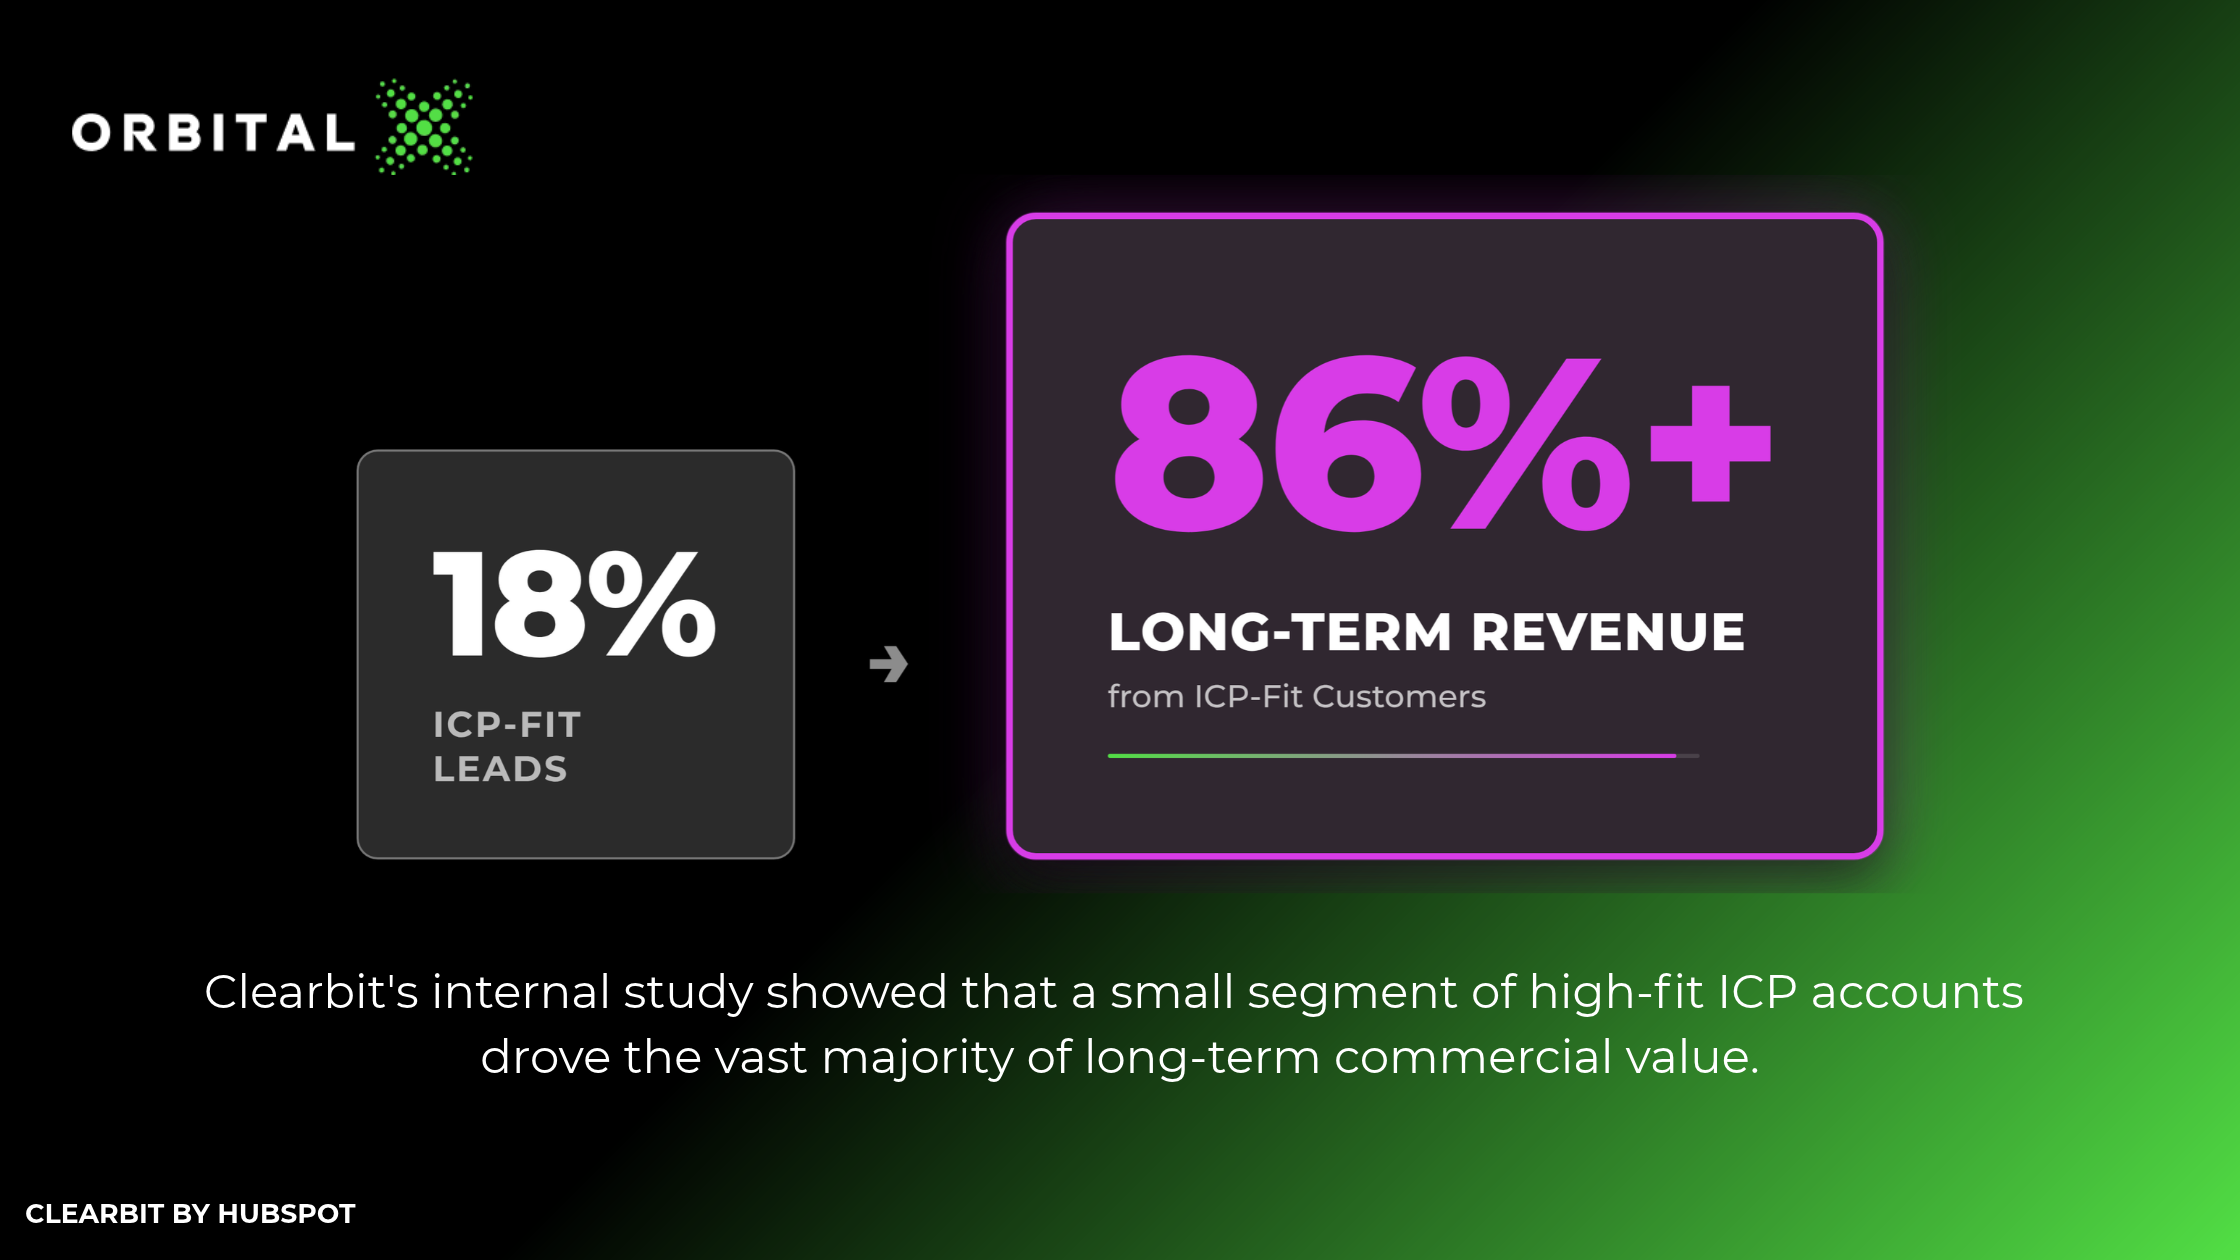 If we apply this to our earlier examples, we might see actions like:
Northstar Analytics (84/100): Reps research the buying committee, marketing creates account-specific campaign assets, and paid media bids aggressively on key decision-makers.
Harbor Systems (48/100): The account enters automated email nurtures without manual rep research or targeted ad spend.
How to Validate and Keep Your ICP Score Current
An ICP scoring model should be validated against actual customer and commercial outcomes. Compare scores with closed-won and closed-lost opportunities, retention, expansion, deal size, sales cycle, and other relevant measures to see whether high-fit accounts behave as expected.
Review the model regularly as the business changes too. New products, market shifts, changes in positioning, new customer segments, and lessons from churn can all change what a good-fit account looks like.
According to Gartner, segmenting accounts by historical commercial performance gives teams a data-driven framework for determining customer value and expansion potential. Continually evaluate your scoring model against actual customer performance to keep pace with market and industry fluctuations.
Validate your scoring logic on a set schedule (quarterly or semiannually) as well by monitoring:
Win Rates: Are Tier 1 accounts converting at a significantly higher rate than Tier 2 and Tier 3 accounts?
Deal Velocity: Do high-scoring accounts move through sales stages faster?
Average Contract Value (ACV): Do higher scores match larger deal sizes?
Retention and LTV: Are top-scoring accounts staying longer and expanding accounts?
Say a business sets up a scoring model where company size carries heavy weight. Over two quarters, win-rate analysis shows that Tier 1 accounts (85+ pts) and Tier 2 accounts (60–79 pts) convert at identical 22% rates.
Upon further investigation, the team discovers employee count no longer predicts deal success, whereas technological compatibility strongly correlates with closed deals. The team lowers company size weighting, increases technology fit weighting, and realigns account tiers to match actual win rates.
Common ICP Scoring Mistakes
ICP scoring breaks down when the model becomes more complicated than the evidence supporting it. This is where you start to see “Captain Obvious” scoring creeping in. Teams end up giving an account's physical country the same weight as its need for the software you're selling. Geography might matter, but it shouldn't outrank the problem you're being paid to solve.
Another common mistake is creating a score without connecting it to action. If a 92 and a 57 produce exactly the same sales and marketing treatment, the scoring exercise isn't helping the team prioritize anything.
Watch out for these practical failure points:
Wishlist Scoring: Building criteria around logos you want rather than characteristics of customers who actually pay and stay.
Bloated Rubrics: Tracking 30-plus criteria just because the data exists, making scores noisy and hard to interpret.
Equal Criterion Weighting: Treating minor attributes like office location with the same importance as core problem fit.
Ignoring Disqualifiers: Letting a high positive score blind you to a technical or regional deal-breaker.
Static Scoring: Keeping the exact same rubric intact after major product launches or market shifts.
Manual Overrides: Allowing reps to ignore scores and pursue low-fit accounts based on personal preference.
For example, a company creates a 25-field model where every attribute gets four points. An account scores 88 points based on industry, locations, software tools, and executive head count but has zero operational need for the product. The model rewards broad fit while missing a complete lack of problem fit.
A rubric proves its worth when it makes the model easier to apply and helps your team make better decisions about where to spend time and money.
Strengthen Your Demand Generation With Tight ICP Scoring
ICP scoring is only useful when it changes what your revenue team does next. A good rubric should influence which accounts get attention, how messaging is shaped, where sales spends its time, and where ABM investment makes sense. If the score sits quietly in the CRM while everyone carries on doing the same thing, congratulations … you've built a spreadsheet.
The real value comes from connecting account fit with the intelligence, messaging, content, and multi-channel activity needed to move those accounts toward revenue. That's where OrbitalX’s DemandWEBS™ platform comes in. It gives revenue teams an integrated way to identify high-fit accounts, develop point-of-view messaging, and activate demand-generation campaigns without piling more work onto an already stretched team.
If your ICP scoring model is telling you who to target but not helping you decide what to do with those accounts, it's time to connect the dots. Book a call with OrbitalX to see how we can connect your targeting, messaging, and demand-generation strategy.
FAQs
How many criteria should an ICP scoring rubric include?
There's no magic number, but three to eight meaningful criteria is a useful starting point. Prioritize characteristics that distinguish your strongest customers from weaker-fit accounts and that can be linked to outcomes like conversion, retention, or expansion. Too few criteria can oversimplify the model, while too many can create noise and make scores difficult to maintain.
What ICP score should trigger direct sales outreach?
There isn't a universal score that triggers sales outreach. Your threshold should depend on how the scoring model distributes across your target accounts and how strongly higher scores correlate with commercial outcomes. Start by defining tiers, then compare them against win rates, deal value, and other relevant results. If Tier 1 accounts consistently produce stronger opportunities, its threshold is working.
Can a company have more than one ICP scoring rubric?
Yes. Multiple products, markets, customer segments, or business models can justify different scoring models. Keep separate models when the underlying buying conditions and customer profiles genuinely differ. Avoid creating multiple rubrics simply because different teams prefer different criteria. Each model should reflect a meaningful difference in who buys, why, and what makes them successful customers.
What data is needed to score accounts automatically?
The required data depends on your rubric’s criteria. Common inputs include company size, revenue, industry, geography, tech stack, growth signals, and intent data. Start with the information that supports your most important scoring criteria. CRM and enrichment tools can automate many account fields, while sales and marketing teams may still need to assess qualitative factors like problem fit or buying potential.
What makes a good ICP scoring rubric?
A good rubric is evidence-based, understandable, actionable, and easy to maintain. It focuses on a manageable number of criteria, weights them according to their commercial importance, includes meaningful disqualifiers, and produces scores that help teams make better decisions about where to spend attention. Most importantly, the model should hold up against real customer outcomes.
More Resources

B2B Product Marketing: Strategy and Execution
Learn how B2B product marketing connects positioning, GTM, sales enablement, and customer outcomes to drive commercial growth.

Risk Tiers and Bureaucracy? The B2B Guide to Earning Market Trust via the EU AI Act
The EU AI Act explained for business leaders: risk-based AI rules, global scope, and how governance maturity enables compliant, scalable AI adoption.

B2B Lead Generation Emails: Templates, Examples, and Strategies
B2B lead generation email templates, examples, and strategies for writing relevant, personalized emails that generate replies and support demand generation.